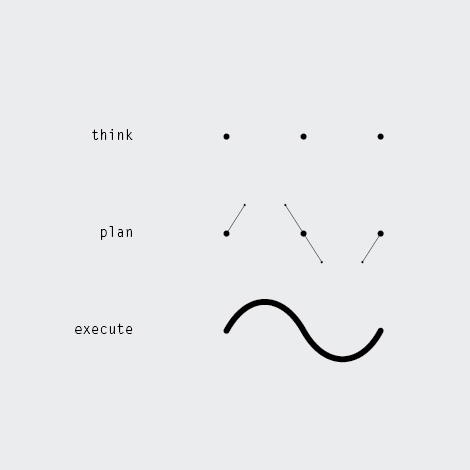
The simple image progression below is amazingly beautiful to me. Representing the stages of any project, the images progress from points to tangents to a wave using Bézier’s Curve.
A Bézier’s curve is commonly used in font types and animation logic.
A small animation showing the plotting of a Bezier curve.

The curve is drawn between 3 Points P0, P1 and P2. The plot follows the moving tangent line shown in green above. The tangent line is made up of two end points which move in time, denoted as Q0 and Q1. Q1 follows a linear path from P0 to P1. Q2, in the same time frame, follows a linear path from P1 to P2. Simple and beautiful.
The Bezier curve in the artist’s rendition follows more of the tranditional Pen tool function in digital art apps like Photoshop or Illustrator where the user can define starting tangents as well as points. The logic is same however.
Found this on one of my favorite blogs, the-design-ark.